
Description of geomagnetic activity
| Zone | Quiet | Unsettled | Active | Stormy | Major Storm |
|---|---|---|---|---|---|
| Polar Cap | 0 - 55 | 56 - 100 | 101 - 179 | 180 - 524 | 525+ |
| Auroral Zone | 0 - 93 | 94 - 168 | 169 - 299 | 300 - 874 | 875+ |
| Sub-Auroral Zone | 0 - 23 | 24 - 43 | 44 - 77 | 78 - 227 | 228+ |
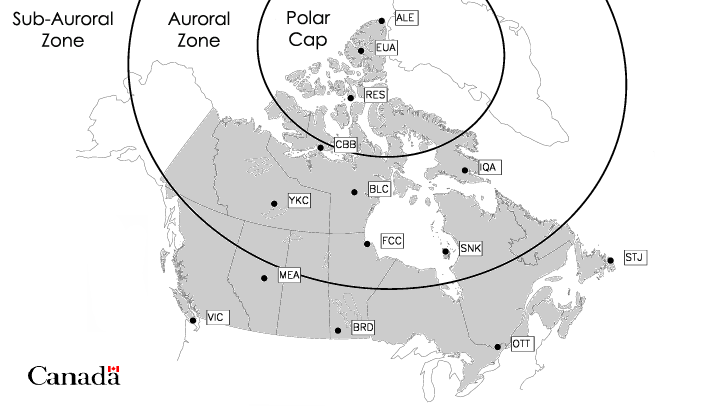
The levels of geomagnetic field activity, or disturbance, currently used in the short-term forecasts are labelled qualitatively for general usage. For each of the three major zones (subauroral, auroral, polar cap), the range of activity typically experienced in the zone is subdivided into five classifications: quiet, unsettled, active, stormy, major storm. The actual boundaries in terms of field intensity vary from zone to zone. This is because, for a given global state of the magnetic field, the auroral zone activity tends to be more intense than that in the polar cap and the subauroral zone. There are many measures of magnetic activity, but we use a simple one that can be determined extremely quickly and that is quite sufficient for this purpose. We consider how much the intensity changes during an hour (ie maximum value - minimum value), known as the hourly range. During an interval of several hours, we consider the median and maximum hourly ranges. The observed (forecast) median range provides the main review (forecast) message, while the maximum observed (forecast) range provides the supplementary review (forecast) message. The intensities are based on measurements derived from representative magnetic observatories in each zone (units are nanoteslas, nT).
For the benefit of those users who need to relate to the Kp index, we provide the following equivalences, which apply to all three of the zones used in our forecasts.
- Activity level quiet is equivalent to Kp values from 0 to 3
- Activity level unsettled is equivalent to Kp values from 3 to 4
- Activity level active is equivalent to Kp values from 4 to 5
- Activity level stormy is equivalent to Kp values from 5 to 7
- Activity level major storm is equivalent to Kp values from 7 to 9
Some information on the Kp index can be found at the following external links: